TAKEO SUMIDA, YOITCHI ARIMITU, TAKASHI TAHARA, HIROAKI IWANAGA
International Journal of Bifurcation and Chaos, Vol. 10, No. 9 (2000) 2246-2255
The presence of deterministic chaos has been clarified experimentally in the time series of pulsation of capillary vessels [Tsuda et ol, 1992]. In this paper, first we reconfirmed the nonlinearity of the time series of pulsation of capillary vessels with surrogate data testing. Second, we investigated the characteristics of chaos of capillary data on normal subjects in different states of the autonomic nervous system and on psychiatric patients. As a result, the chaotic fluctuations decreased for the state of sympathetic dominance of normal subjects. On the contrary, the chaotic fluctuations increased for the state of parasympathetic predominance of normal subjects. We also found that the chaotic fluctuations decreased in the symptomatic phase of psychiatric patimits. Interpretation of this fact is as follows.
Psychiatric patients in symptomatic phase are in a condition of poor flexibility of emotion and motivated behavior in the limbic system. This condition affects the regulation of the autonomic nervous system in the hypothalamus. So it is easy to fall into the imbalance of the autonomic nervous system even with slight stress. Furthermore, in the attractor of capillary chaos we found two parts that showed the role of origin of stimulation of the sympathetic nervous system and that of stimulation of the parasympathetic nervous system, respectively. The geometrical change of topology was caused by the interplay of two parts. From our study we concluded that chaos of pulsation in capillary vessels reflected mental conditions through the autonomic nervous system.
1. Introduction
There is no widely accepted definition of chaos except one- and two-dimensional maps, and three-dimensional vector fields which exhibit homoclinic or heteroclinic orbits. Furthermore, the presence of a positive Lyapunov exponent is a practical definition of chaos [Tsuda et of., 1992]. Generally speaking, it can be defined as a phenomenon which is complex and unstable though the phenomenon is under the control of deterministic rule. And the future of the phenomenon is unpredictable [Parker & Chua, 1989]. As a result of the recent develop ment of dynamical systems’ theory [Packard et al., 1980; Thkens, 1981], the presence of deterministic chaos has been clarified experimentally in the time series of a single variable obtained from various human organs, for example, electro-encephalogram [Babloyantz, 1986; Layne et al., 1986], electrocardiogram [Babloyantz et d., 1988; Goldberger et al., 1988; Tsuda et al., 1992], human finger’s capillary vessels [Tsuda et al, 1992], and focal accommodation systems of human eyes [Smnida et al, 1994]. Especially, it has been pointed out that the chaos of pulsation in capillary vessels involved a possibility of dependence on mental and physical conditions [Tsuda et d., 1992]. Before the development of this theory, one tried to analyze complex motions of time series with decomposed information which was obtained by the conventional methods such as average, standard deviation, spectrum analysis, and a local wave’s shape in time series.
On the other hand, this theory enables us to analyze complex motions as an entity [Campbell et al., 1984]. However, the erratic fluctuations that are observed in an experimentad time series owe their dynamical variation to a mix of various influences: chaos, nonchaotic but still nonlinear determinism, linear correlations, and noise, both in the dynamics and in the measuring apparatus [Theiler et al., 1992], and the analytical techniques of dynamical analysis can easily produce misleading conclusions. Several previously published reports of chaotic behavior in biological signals have failed to get support from surrogate data procedures [Theiler et al., 1992]. It is essential to confirm capillary chaos with calculations using surrogate data. Hence, we tried to reconfirm the nonlinearity of the time series of pulsation of capillary vessels with the surrogate data testing. Furthermore, we measured the time series of pulsation in capillary vessels, namely peripheral blood pressure, of normal subjects in different states of the autonomic nervous system, and also measmred that of psychiatric patients. Then, we extracted chaos from these data, and investigated the relation between characteristics of chaos and the states of subjects with the geometry of attractor and the largest Lyapunov exponent (λi) [Wolf et al., 1985; Tsuda et al., 1992].
2. Subjects and Methods
2.1. Subjects and experiments
We measured the digitized waveform of the pulsation in capillary vessels with a sampling frequency of 200 Hz with 12 bit resolution of forty, normal subjects, aged 19-76 years from the forefinger of the right hand, and also measured that of ten psychiatric patients. Patients 1-6 were in symptomatic phase, and then became in remitted phase. Patient 7 was kept on symptomatic phase. Patients 8-10 who had a history were in continuous remitted phase for a long period. We selected patients for whom the pharmacotherapy was continued without the modification of its quantity and quality.
We noticed that the right hand data is more sensitive to subject’s conditions. It is probably due to the reason that most subjects measured so far were right-handed.
The treadmill stress test was performed with 11 normal subjects, aged 19-61 years. The pulsation in capillary vessels was measured before and immediately after the test. A test of aroma-exposure of lavender was done with 12 normal subjects, aged 24-55 years. Namely, they took some rest for five minutes in a room, and the data of the pulsartion were measured, and then the pure essential oil of lavender (Aromatherapy Products Limted) was indirectly heated in the same room. After five minutes, the data were measured again. In psychiatric patients, and in normal subjects for the above two tests, the pulse rate and the blood pressure of subjects were measured simultaneously.
2.2. Analytical techniques of dynamical systems’ theory
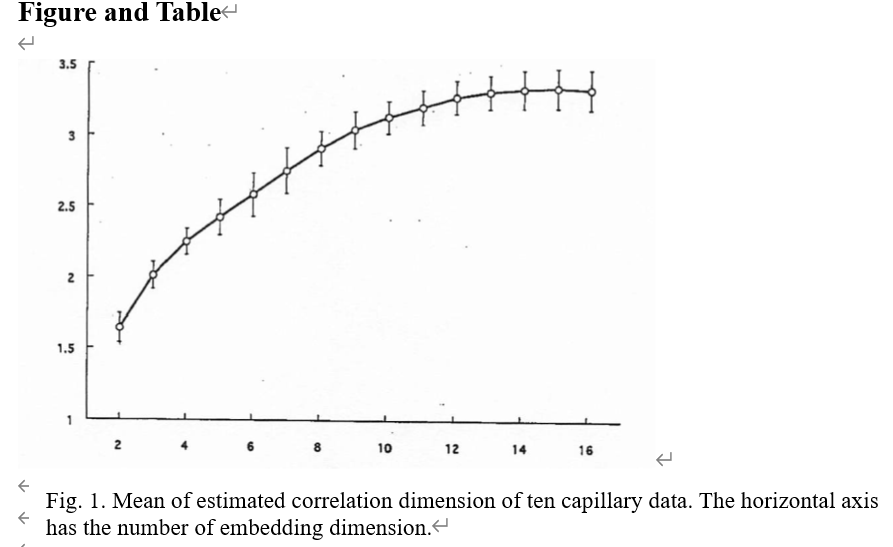
We caluculated the correlation dimension of ten capillary data using Grassberger and Procaccia method [Grassberger &; Procaccia, 1983] in order to determine the embedding dimension, and then reconstructed the attractor of chaos by embedding the obtained capillary data into four-dimensional phase space [Packard et al., 1980; Takens, 1981; Tsuda et el.,, 1992]. The delay time τ was taken at 50 msec. The delay time τ was investigated [Tsuda et al., 1992]. We adopted the same one. We also calculated the largest Lyapunov exponent (λ1) indicating orbital instability by the Wolf method [Wolf et al., 1985; Tsuda et al., 1992].
2.3. Statistical analysis
In the above two tests, the paired t-test and Willcoxon test were executed to investigate the change of the blood pressure, the pulse rate and λ1 between, before and after the test in each subject.
2.4. The surrogate data testing
Our data have not been processed with any filtering procedure. However, an experimental time series is influenced by various conditions both in the dynamics and in the measuring process [Theiler et al., 1992]. Furthermore, the time series is interval data. The process by which it is converted to a wave form is itself a filtering procedure. This filtering process can produce the appearence of low-dimensional structures that do not exist in the original data [Rapp et al., 1993]. It is said that the surrogate data testing can be used to determine if analytical techniques of dynamical analysis have produced misleading conclusions. Hence, we used the surrogate data testing to confirm our result for correlartion dimension and the largest Lyapunov exponent (λ1). We examined our result with the Algorithm 1 surrogate data. Algorithm 1 constructs the surrogate data set in a three-step process [Rapp et al., 1993].
(1) Determine the Fourier transform of the original data set.
(2) Randomize the phases of this Fourier transform.
(3) Produce a surrogate data set by taking the inverse transform.
Algorithm 1 directly examines the null hypothesis that the signal in question is linearly correlated noise. If calculated results from the original and its surrogate are significantly different, the null hypothesis fails, and it is concluded that the original data set is not simply linearly correlated noise. A term “significantly different” must be determined. The significance S is defined as follows.
MORIG is a calculated result from the original data. \( <M_{surr}>\) is the mean of calculated results from the surrogates, and \(\sigma_{surr} \) is the standard deviation of calculated results from the surrogates.
Theiler suggested that a value S~2 is not significant but S~10 is highly significant [Theiler et al., 1992; Rapp et al., 1993]. Furthermore Rapp presented more rigorous statistical criteria for rejecting the surrogate null hypothesis. Given the assumption that the values obtained with surrogates from a Gaussian distribution, the probability that \(M_{surr} \) will be less than \(M_{ORG} \) is given as follows.
Alternatively, PM, the Monte Carlo probability is defined as follows.
According to a nonparametric test for rejecting the null hypothesis, it is rejected if \(M_{ORIG}<M_{surr} \) for all surrogates; the corresponding confidence level is \(p=\frac{1}{\left(N_{surr}+1\right)}\) , \(N_{surr}\) is the number of the surrogates [Rapp et al., 1993].
On the other hand \(M_{surr}\) will be more than \(M_{surr}\) , the probability \(P\left(M_{surr}\le M_{ORIG}\right) \) is the same equation.
The Monte Carlo probability is defined as follows.
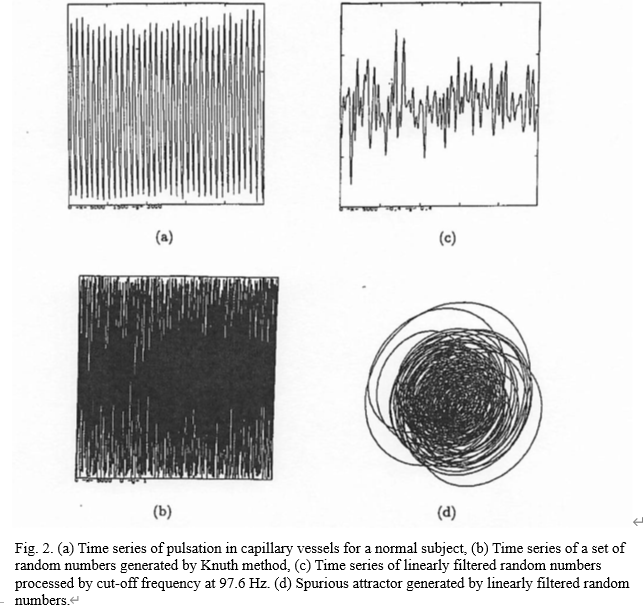
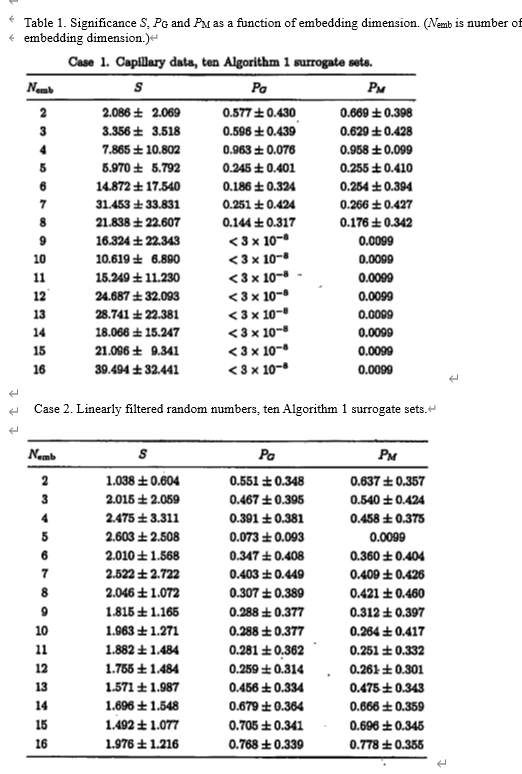
In this case if \(M_{ORIG}<M_{surr} \) for all surrogates, the nonparametric test rejects the null hypothesis. We produced ten Algorithm 1 surrogate sets for capillary data and linearly filtered random numbers, respectively. A set of random numbers was generated by Knuth method [Knuth, 1981]. The linearly filtered procedure for the random numbers was the cut-off frequency at 97.6 Hz. Then, we calculated correlation dimension of the original data and surrogate data using the Grassberger and Procaccia method, and also calculated the largest Lyapunov exponent (λ1) of the original data and surrogate data. Furthermore, we calculated the significance S, PG and PM.
3. Results
The result of calculations of correlation dimension of ten capillary data is shown in Fig. 1. Linearly filtered random numbers using cut-off procedure generated a spurious attractor [Fig. 2(d)]. For correlation dimension the significance S of ten Algorithm 1 surrogate sets for capillary data was high, and the null hypothesis was rejected in the embedding dimension above 9; the corresponding confidence level is p = 1/101 because all the surrogates above embedding dimension 9 are \(M_{surr}< M_{ORIG} \) .
For the other hand, the significance S of ten Algorithm 1 surrogate sets for linearly filtered random numbers was low, and then the nonparametric test failed to reject the null hypothesis except for the case of embedding dimension 5 in Table 1.
For the largest Lyapunov exponent (Ai), the significance S of ten Algoritlim 1 surrogate sets for capillary data was 12.076470 ± 3.646386, and all surrogates are less than and the null hypothesis was rejected; the corresponding confidence level is p = 1/101. The value of PG< 3 x 10-S. For linearly filtered random numbers, the value of the significance S, PG, PM were 0.609078 ± 0.302132, 0.555959 ± 0.245434 and 0.552311 ± 0.243530. The nonparametric test failed to reject the null hypothesis.
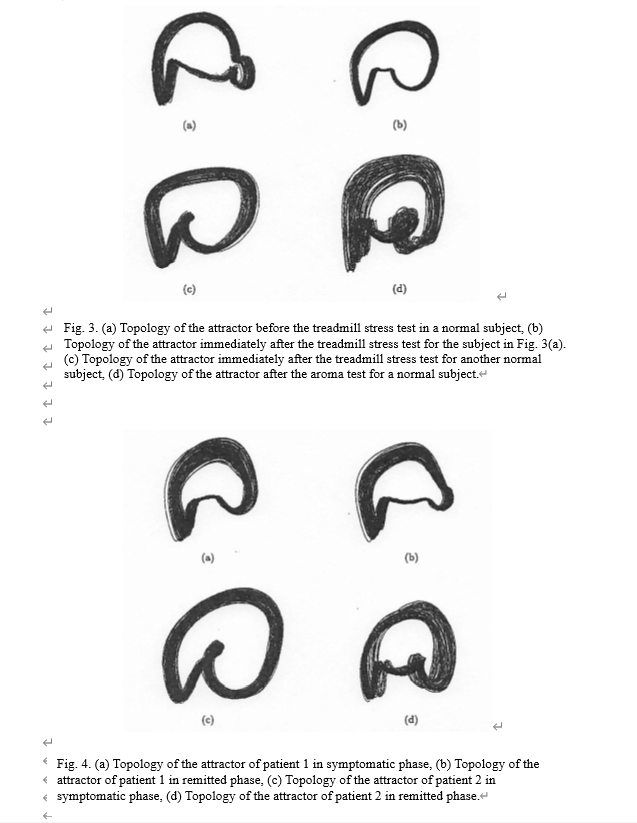
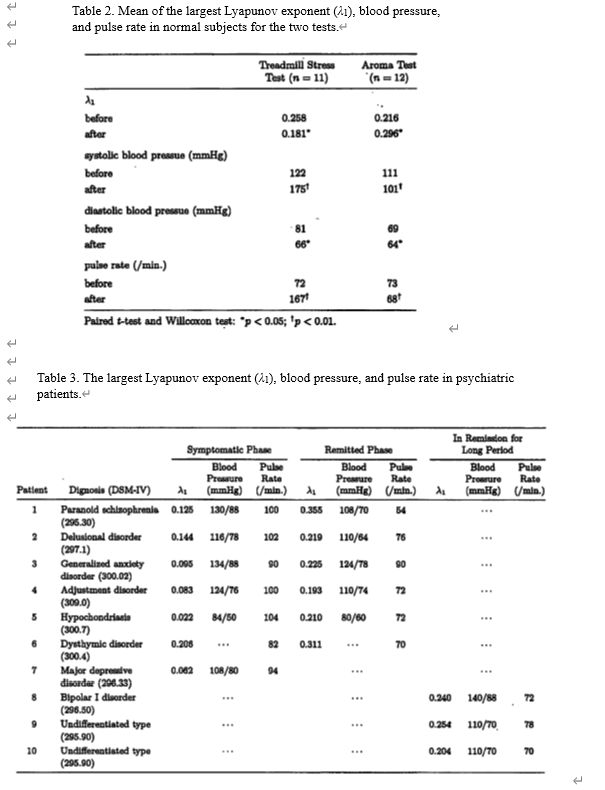
The geometry of attractor of normal subjects showed a typical shape [Fig. 3(a)], whereas after the treadmill stress test and in the symptomatic phase of the psychiatric patients its attractor showed either one type or another [Figs. 3(b), 3(c), 4(a) and 4(c)]. The geometry of attractor of the patients in remitted phase, or remission was like the normal type [Figs. 4(b) and 4(d)]. On the other hand, after the aroma test a different type appeared [Fig. 3(d)]. The mean of λ1 of forty normal subjects was 0.252 ± 0.075. λ1 after the treadmill stress test significantly decreased (p < 0.05 Table 2). λ1 in the symptomatic phase of the psychiatric patients has lower value, and increased in the remitted phase (Table 3). After the treadmill stress test, the pulse rate and the systolic blood pressure significantly in creased (p< 0.01 Table 2), and the diastolic blood pressure significantly decreased (p < 0.05 Table 2) in each subject. In the symptomatic phase of the psychiatric patients, the pulse rate showed a trend of slight increase, and then in the remitted phase the pulse rate and the blood pressures showed a trend to slight decrease (Table 3).
On the other hand, after the aroma test λ1significantly increased (p < 0.05 Table 2), and the pulse rate (p < 0.01 Table 2) and the blood pressures significantly decreased (systolic p < 0.01, diastolic p < 0.05 Table 2) in each subject.
4. Discussion
First, it has been said that chaos of biological systems, especially EEG signals may have a simpler stochastic description and may be spurious [Achermann et al, 1994). The surrogate data testing has been propounded to differentiate nonlinearity and chaos in experimental time series from linear stochastic processes, or colored noises [Theiler et al., 1992; Rapp et al., 1993]. In a recent study, however, it is reported that the surrogate data testing alone may not be a sufficient test for distinguishing colored noises from low-dimensional chaos, and that it may only distinguish very low (dimension < 5) dimensional chaotic signals from very high frequency colored noises [Pradhan & Sadasivan, 1997]. With the surrogate data testing we tried to reconfirm nonlinearity of capillary data. Its result supported that its dynamics was chaotic. Furthermore, capillary data have a limiting correlation dimension (Fig. 1) and at least one possitive Lyapunov exponent. A possible model for the geometry of the attractor has been shown as three-dimensional solid torus with a screw type of structure of torus as a part of the three-dimensional Poincare’ maps [Tsuda et al., 1992]. From these facts we conclude that the time series of capillary vessels is low dimensional chaos.
Second, intensive exercises cause the secretion of norepinephrine from the sympathetic endings, and also cause the release of epinephrine and norepinephrine from the adrenal medulla [William et al., 1991]. As its result, pulse rate and systolic blood pressure increase, and diastolic blood pressure decreases [Goldberg, 1968]. Namely, intensive exercises lead subjects to have sympathetic dominance. On the other hand, it has been supposed that the aroma of herbs has an effect on mental and physical states, since Rene’-Maurice Gattefosse’ proposed aromatherapy [Jean, 1964]. In recent studies, especially by the analysis of the contingent negative variation in EEG Lorig and Roberts reported that the aroma of lavender produced physical activities of mental relaxation [Lorig et al., 1990]. Shibata et al. also reported that the immunity of mice exposed to high pressure stress was regained by a certain aroma [Shibata &et al., 1990].
In our study, we considered subjects to be of sympathetic dominance by the treadmill stress test because of the significant increase of the pulse rate and the systolic blood pressure, and due to the significant decrease of the diastolic blood pressure. We also considered that the aroma of lavender led the subjects to be of parasympathetic predominance because of the significant decrease of the pulse rate and the blood pressures (Table 2). In the treadmill stress test λ1 decreased, and in the aroma test λ1 increased. This fact means that the chaotic fluctuations of pulsation in capillary vessels decrease when the sympathetic nervous system is stimulated, and increase when the parasymparthetic nervous system is stimulated. Futhermore, in spite of no or a slight change of physiological conditions, λ1 of symptomatic phase of the psychiatric patients decreased, and the geometry of the attractor coincided with that of intensive exercises that led subjects to be of supreme sympathetic dominance. Then λ1 increased, and the geometry of the attractor was near normal type when patients were in the remitted phase.
Traditionally, anxiety involves feelings of cares and worries, then physiological changes e.g. for example, elevation of blood pressure and increase of heart rate, occur. On the other hand schizophrenia is a disorder of emotions and behavior, and depression is a lower function of emotion and behavior.
Up to this time it has been reported that shorter cardiac interbeat intervals and lower high frequency spectral power were observed in general anxiety disorder and worry or in schizophrenia. And the authors have pointed out that these facts are associated with lower cardiac vagal control [Julian et al., 1996; Dolores et al., 1997]. However, we think that it is difficult to explain our results with lower cardiac vagal control. A biological interpretation of our results is as follows. When the biological system copes with a specific purpose such as an increase in cardiac output or copes with external stress, it limits its own fluctuations and arranges for sympathetic dominance. The limbic system which is the center of emotion and motivated behavior closely relates to activities of the hypothalamus which is the center of the autonomic nervous system. Psychiatric patients, especially, in symptomatic phase, lose the flexibility of emotion and motivated behavior in. the limbic system. This condition affects the regulation of the autonomic nervous system in the hypothalamus. Consequently, psychiatric patients are easy to get into lower complexity and flexibility of the autonomic nervous system, and the sympathetic predominance is even caused by slight external stress. And when the psychiatric patients are in remitted phase, they regain chaotic fluctuations. On the contrary, mental relaxation is a sort of preparartory state to cope with various unspecified sress or unknown events. In this condition, the flexibility of the control for emotion and behavior must increase in the limbic system. As a result, the chaotic fluctuations of the regulation of the autonomic nervous system increase, and the parasympathetic predominance is arranged. Spectrum analysis offers only decomposed information. Therefore, it has its limitation for analysis of complex phenomenon.
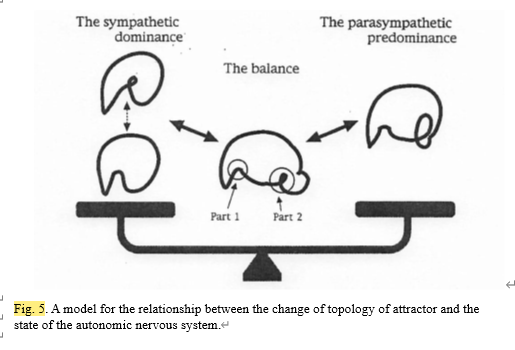
In this paper, we propose a model for the relationship between the change of topology of attractor and the state of the autonomic nervous system (Fig. 5). Namely, the orbits are attracted to part 1 in Fig. 5 during the sympathetic dominance. On the contrary, the orbits are attracted to part 2 in Fig. 5, and this part 2 dynamically grows during the parasympathetic predominance. In three-dimensional flow, the coincidence of two two-dimensional manifolds (one stable, the other unstable) at two spiral saddles becomes an invariant sphere with a north pole and a south pole [Shil’nikov, 1965]. The coincidence is exceptional. When these is a split between them, it yielded a Shil’nikov phenomenon [Broer et al., 1984]. The muscular movements affecting the thickness of the lens mid the size of the pupil in human eyes are controlled by the autonomic nervous system. Fluctuations in these movements were chaotic, and also these fluctuations had a Shil’nikov phenomenon. One pole of the Shil’nikov type attractor corresponded to the pole of stimulation of the sympathetic nervous system while the other pole corresponded to the pole of stimulation of the parasympathetic nervous system. Interplay of two poles causes the geometrical change of topology [Sumida et al., 1994]. Capillary chaos does not have a Shil’nikov phenomenon. But part 1 showed the role of origin of stimulation of the sympathetic nervous sjrstem, and part 2 showed the role of origin of stimulation of the parasympathetic nervous system, respectively. And it seems that the geometrical change of topology is even caused by the interplay of two parts. Therefore, we considered that part 1 is a pole of the sympathetic nervous system while part 2 is a pole of the parasympathetic nervous system. Observing two poles enables us to grasp the state of balance between the sympathetic nervous system and the parasympathetic nervous system, and each activily level of the sympathetic and the parasympathetic nervous systems.
From our study, we conclude that chaos of the pulsation in capillary vessels sensitively depends on the state of the autonomic nervous system, and then reflects the mental conditions through the autonomic nervous system.
Acknowledgments
We thank Professor Ichiro Tsuda, Department of Science, Hokkaido University for useful discussions.
References
Achermatm, P., Hartmann, R., Gunzinger, A., Guggenbuhl, W. & Borbe’ly, A. A. [1994] “All-night sleep EEG and artifactual stochastic control signals have similar correlation dimensions,” Elctroencep. Clin. 90, 384-387.
Babloyantz, A. [1986] “Evidrace of chaotic dynamics of brain activity during the sleep cycle,” in Dimensional and Bntopies tn Chaotic Systems, ed. Mayer-Kress, C. (Springer-Verlag, Berlin), pp. 241-245.
Babloyantz, A. & Destexhe, A. [1988] “Is the normal heart a periodic oscillator?” Biol. Cybem. 58, 203-211.
Broer, H. W. & Vegter, G. [1984] “Subordinate Shil’nikov bifurcations near some singularities of vector fields having low codimension,” Ergod. Th. Dyn. Syst. 4, 509-525.
Campbell, K., Crutchfield, J. P., Farmer, J. D. & Jen, E. [1984] ‘Tixperimental mathematics: The role of computation in nonlinear science,” Comm. AC. 28, 374-384.
Grassberger, P. & Procaccia, I. [1983a] “Characterization of strange attractors,” Phys. Rev. Lett. 50, 346-349.
Grassberger, P. & Procaccia, I. [1983b] “Measuring the strangeness of strange attractors,” Phyaica D9, 189-208.
Goldberg, L. I. [1968] “The use of sympathomimetic amines in the treatment of heart failure,” Am. J. Cardiol 22, p. 117.
Goldberger, H. L., Rigney, D. R., Mietus, J., Antman, E. M. & Greenwald, S. [1988] “Nonlinear dynamics in sudden cardiac death syndrome: Heart rate oscillations and bifurcations,” Bxperiervtia 44, 983-987.
Jean, V. [1964] Aromathe’rapie (0. W. Daniel, Great Britain).
Julian, F. T., Ededman, B. H. & Borkovec, T. D. [1996] “Autonomic characteristics of generalized anxiety disorder and worry,” Biol. Psychol. 39, 255-266.
Knuth, D. E. [1981] Seminumeruxd Algoriihms (AddisomWesley, Reading MA.). Layne, S. P., Mayer-Kress, G. & Holzfiiss, J. [1986] “Problems associated with dimentional analysis of electroencephalogrsun data,” in Dimensional and Entopiea in Chaotic Systems, ed. Mayer-Kress, C. (Springer-Verlag, Berlin), pp. 246-256.
Lorig, T. S. & Roberts, M. [1990] “Odor and congnitive alteration of the contingent negative variation,” Chem. Senses 15, 537-545.
Malaspina, D., Bruder, G., Dalack, G. W,, Storer, S., Kammen, M. V., Amador, X., Glassman, A. & Gorman, J. [1997] “Diminished cardiac vagal tone in schizophrenia; Associations to brain laterality and age of onset,” Biol. Psychol. 41, 612-617.
Packard, N. H., Crutchfield, J. P., Farmer, J. D. & Shaw, R. S. [1980] “Geometry from a time series,” Phys. Rev. Lett. 45. 712-715.
Parker, T. S. & Chua, L. O. [1989] Practical Numerical Algorithms for Chaotic System (Springer-Verlag, NY), pp. 18-29.
Pradhan, N. & Sadasivan, P. K. [1997] “Validity of dimensional complexity measures of EEG signals,” Int. J. Bifurcation and Chaos 7(1), 173-186.
Rapp, P. E., Albano, A. M., Schmah, T. I. & Farwell, L. A. [1993] “Filtered noise can mimic low dimensional chaotic attractors,” Phys. Rev. E47(4), 2289-2297.
Rapp, P. E., Albano, A. M., Zimmerman, I. D. & Jimenez-Montano, M. A. [1994] “Phase-randomized surrogates can produce spurious identifications of non-random structure,” Phys. Lett. A192, 27-33.
Shibata, H., FVdiwara, M., Iwamoto, M., Matsuoka, H. & Yokoyama, M. M. [1990] “Recovery of PFC in mice exposed to high pressure stress by olfactory stimulation with fragrance,” Int. J. Neurosci. 51, 245-247.
Shil’nikov, L. P. [1965] “A case of the existence of a countable number of periodic motions,” Sov. Math. Dokl. 6, 163-166.
Sumida, T., Tahara, T. & Iwanaga, H. [1994] “Physiolog ical significance of the Shil’nikov phenomenon in the focal accommodation system of human eyes,” Int. J. Bifurcation and Chaos 4(1), 313-324.
Takens, F. [1981] “Detecting strange attractors in turbulence,” Lecture Notes in Mathematics 898, eds. Rand, D. & Young, L. S. (Springer-Verlag, Berlin), pp. 366-381.
Theiler, J., Eubank, S., Longtin, A., Galdrikian, B. & Frarmer, D. [1992] “Testing for nonlinearity in time series; the method of surrogate data,” Physica D58, 77-94.
Tsuda, L, Tahara, T. & Iwanaga, H. [1992] “Chaotic pulsation in capillary vessels and its dependence on mental and physical conditions,” Int. J. Bifurcation and Chaos 2(2), 313-324. .
William, D. M., Fank, I. K. & Victor, L. K. [1991] “The cardiovascular system, Systems of energy delivery and utilization, and the endocrine system and exercise,” Exercise Physiology, eds. William, D. M., Fank, I. K. & Victor, L. K., 3rd edition (Lea & Febiger, Philadel phia), pp. 297, 316 and 389-399.
Wolf, A., Swift, J. B., Swinney, H. L. & Vastano, J. A. [1985] “Determining Lyapunov exponents from a time series,” Phycica D16, 285-317.

コメント